UX/UI, PRODUCT DESIGN, BRANDING
CLARAVINE

The Challenge
The increasing dispersion of marketing tools and teams generating tracking often leads to digital experience data that is inconsistent and highly inaccurate. This lack of effective tracking can lead to misspent advertising and limited visibility into the actual drivers of campaign performance.
The need was for a tool that standardized the taxonomy, creation of a governed process, and be able to validate campaign readiness.
CLIENT
ROLE
TECHNOLOGY
Claravine
Lead Product Designer
Sketch, Invision, Lucid Charts

Discovery
Discover and research to define user scenarios and workflows
Wireframe
Use Cases, Work flow(s), Site Map, Wireframing, Major Interactions
Prototype
Visual design, Style Guide, Screen Mockup’s, Interaction
Validate
Get quick and often feedback from stakeholders and team members
Test
Meet and test actual users and observe user interactions and record results
SUMMARIZE
Validate and learn from users’ behaviors. Analyze user feedback and results from testing. Iterate as needed
PROCESS AT A GLANCE
The Solution.
The software that Claravine had built (Tracking First) was functional, but as the customer base grew, certain issues began to surface. This led to discussions around the need for a more robust UX approach.
Opux was brought onboard to establish a dedicated UX process, since Claravine had not previously implemented one in-house. Our approach included introducing design thinking principles, developing a design system, selecting the right tools for design and testing, and making sure UX had a meaningful presence in decision-making discussions.
Once we defined this UX process, we focused on resolving the identified challenges. We began by reaching out to key customers and gathering in-depth feedback about how they used the tool. We wanted to understand their daily workflows, their pain points, and how the tool fit into their broader responsibilities. From there, we created user flows and journey maps to visualize the data we collected.
During our engagement, we met daily with business analysts, product owners, developers, and other stakeholders. These meetings allowed us to clarify requirements, navigate technical constraints, and stay aligned on progress. Based on these insights, we created wireframes and refined them in a continuous, iterative cycle, incorporating feedback from both testing and stakeholder input.
By combining user-centered research, close collaboration, and continuous iteration, Opux helped Claravine establish a solid UX foundation that effectively supports its growing customer base.


Core Issue: Human Error
After reviewing several core challenges, we discovered that the most significant concern was a lack of consistency in how campaigns and tracking were created. We determined that a large portion of digital media spend, about 40 to 60 percent, was tracked ineffectively because of simple human error. Our team recognized the need to reduce that risk, so we focused on automating major parts of the process to minimize manual mistakes.

Manual Process
We identified several common roadblocks to effective media analytics. We also outlined which parts of the campaign process most often lead to tracking errors and recommended key steps to help avoid these mistakes through automation.
Those details are then exported into a trafficking sheet in Excel, where teams or agencies fill in the data fields for each ad variation. Populating these sheets is time-consuming, and human error at critical stages can compromise data quality by the end of the campaign.
Some issues we noted include:
Mistakes during data entry that create inconsistent tracking codes and landing page URLs
Inconsistent codes and URLs that fail to capture necessary metadata
A high volume of lines for each ad iteration, making data quality checks more complex
Loss of valuable metadata that disrupts downstream campaign views
Depending on the scale of a campaign, a trafficking sheet may contain hundreds or even thousands of lines for each ad iteration, adding to the challenge of manual checks and validation.

Automated Process
The primary challenge in a standard media campaign process is the margin for error caused by extensive manual data entry across multiple teams and platforms. To eliminate these errors and ensure accurate media data, the source of the data must be governed.
Once a trafficking sheet is populated, a governance platform can:
Ingest, validate, and standardize metadata
Confirm that tags, codes, and pages are ready
Append missing data
Bulk export metadata to demand-side platforms (DSPs) with the required structure
Centrally manage changes to and consistency of taxonomies
By automating these critical steps, the launch of digital experiences becomes faster and provides precise, granular data for analysis.
“Claravine is a fantastic solution that accelerates the process of getting sound campaign tracking reports up and running. The intuitive and user-friendly interface quickly reduces errors and enhances the workflow around multi-campaign tracking. We recommend it to all our clients!”
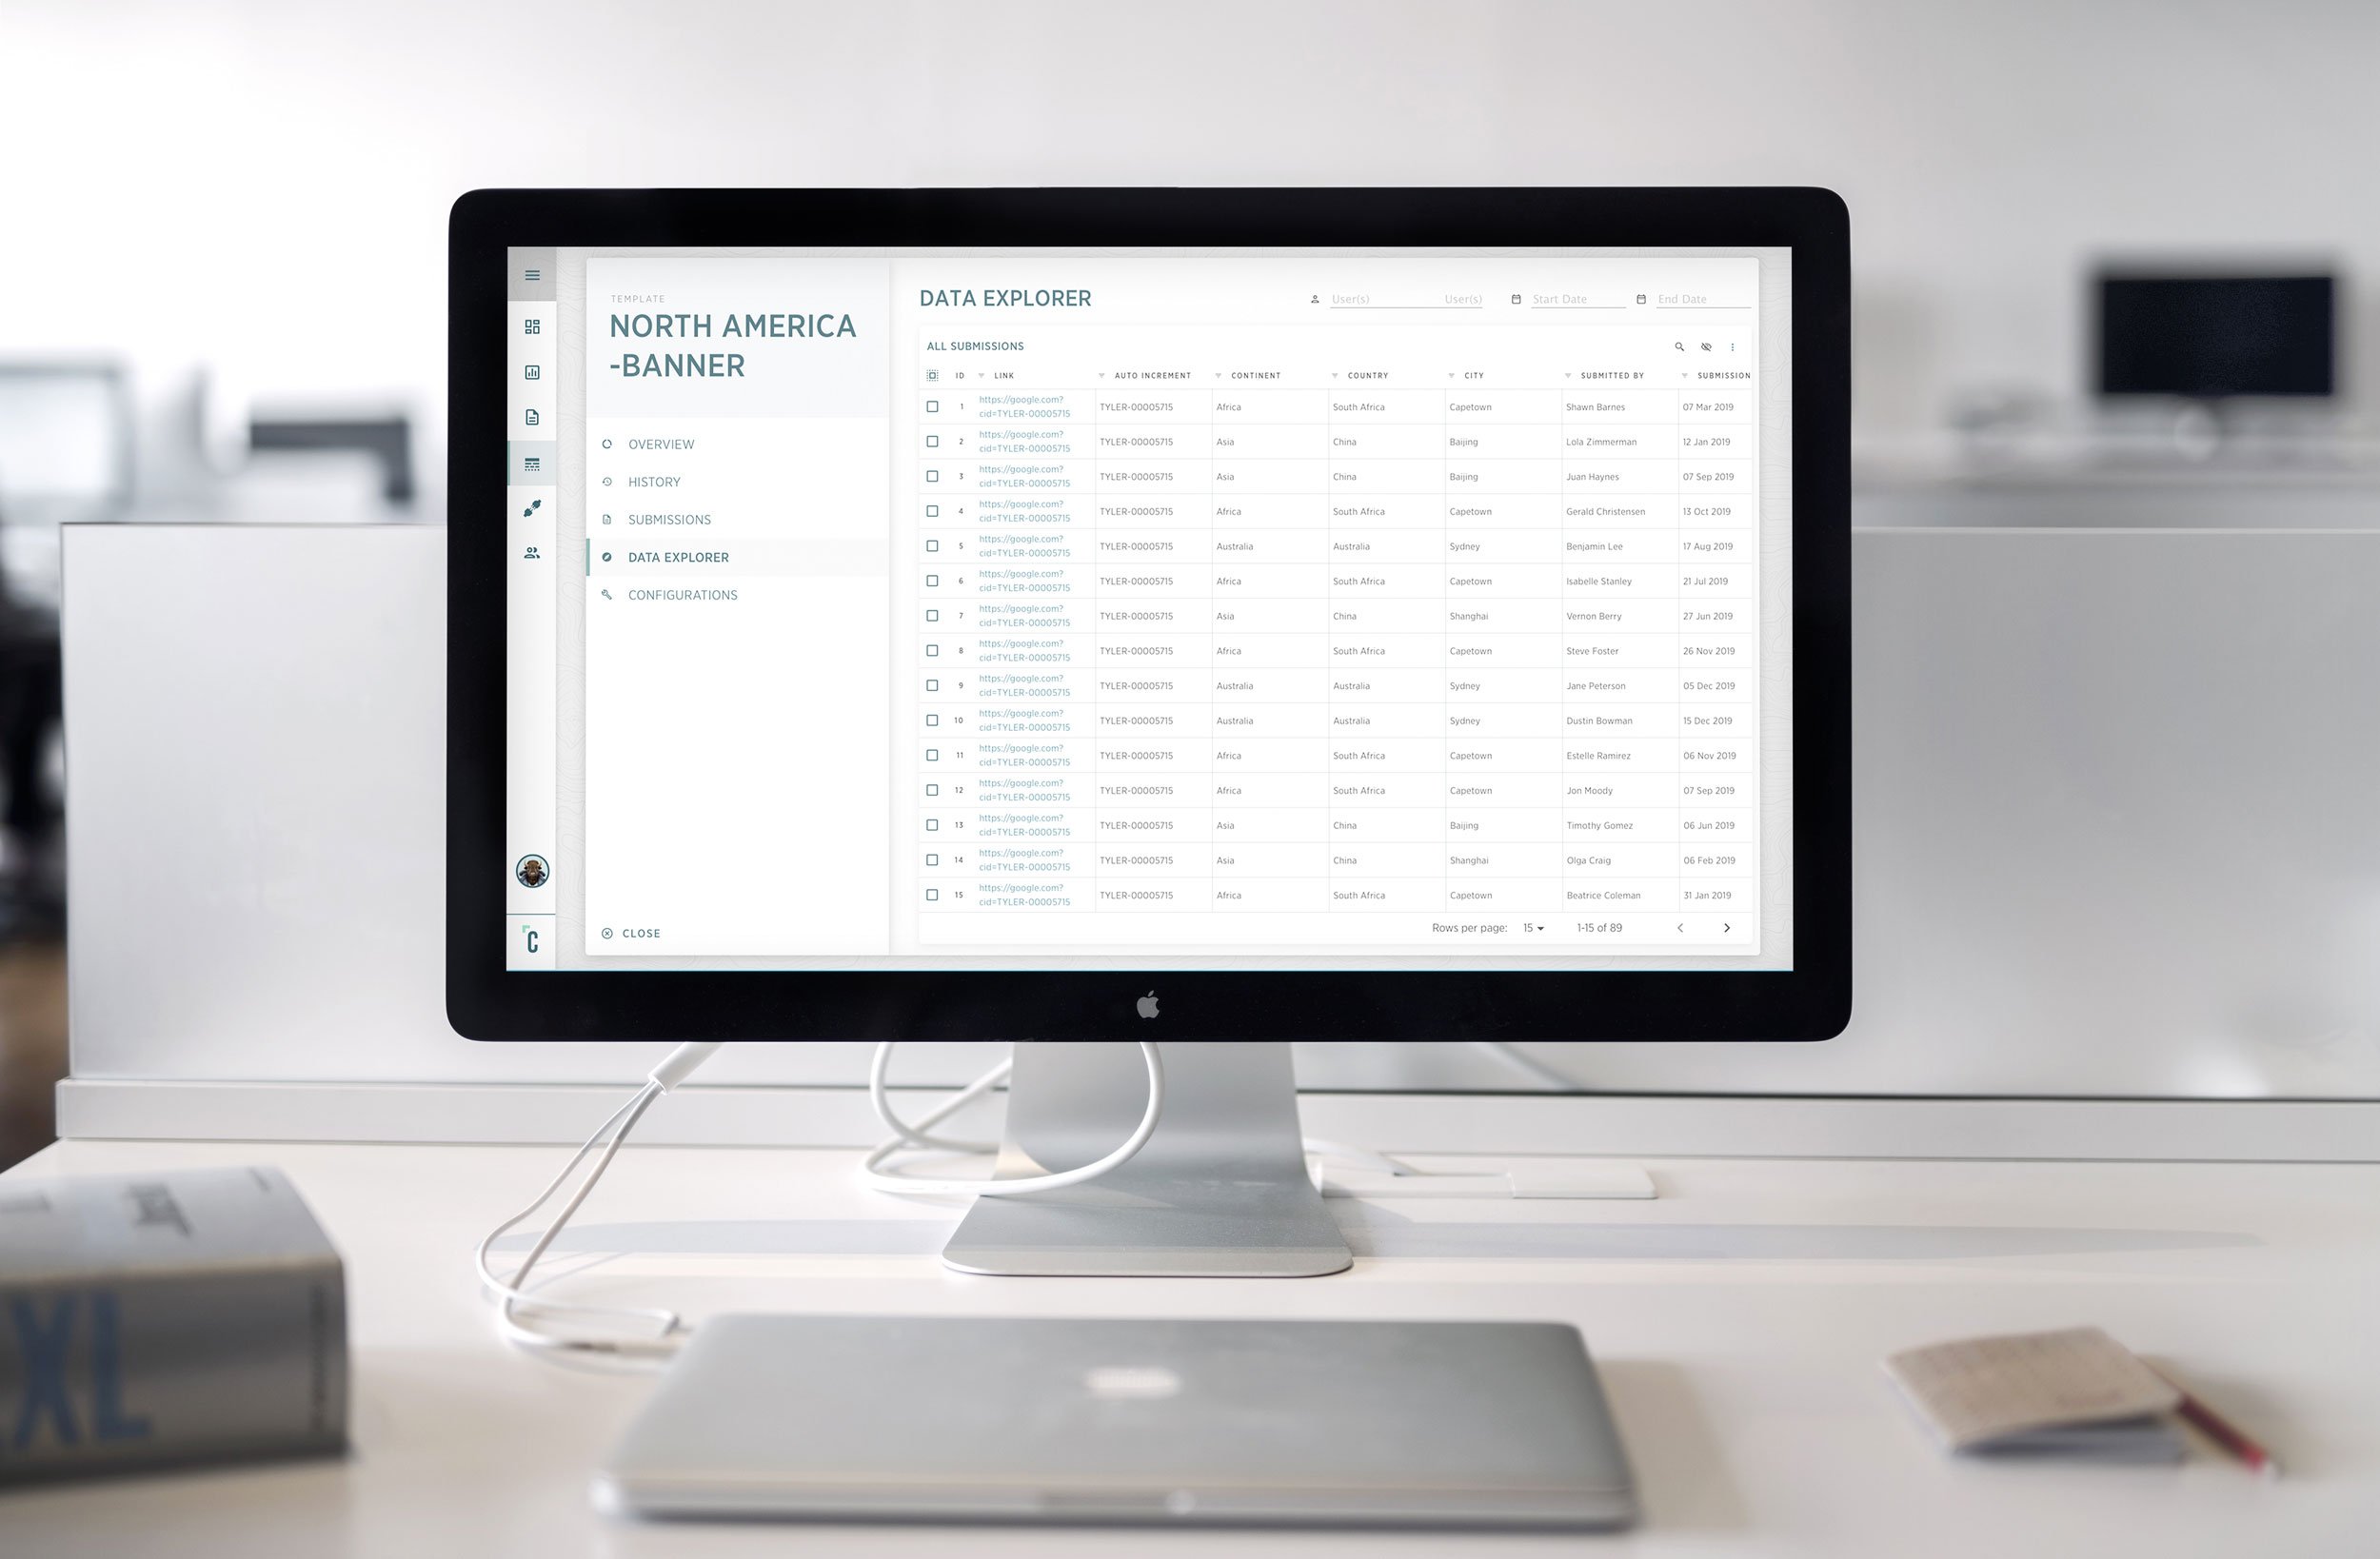
Original DesignFinal Design
Desktop - New Template